Stress-test your strategy.
A backtest gives you one timeline. The market only ran once, and a single equity curve hides how badly the same strategy could perform if the wins and losses fell in a different order. Monte Carlo runs the same rules, same numbers through hundreds of randomized sequences and shows the spread of outcomes you actually have to plan for.
Plug in the variables your strategy actually has, starting balance, risk per trade, win rate, payoff ratio, and a trade volume, and the simulator reports the worst run, the best run, and where most outcomes cluster. The drawdowns you see here are the drawdowns you should be prepared to sit through live.
Educational tool for risk modelling. Not investment advice.
Initial balance
$3,000
Result balance
$8,426
Return % after whole period of trading
180.9%
Maximum drawdown
-6.4%
Max consecutive losses
6
Max consecutive wins
12
Win trades percentage
55.3%
| 2027 | Results % | Results $ |
|---|---|---|
| Jan | 2.5% | $75 |
| Feb | -1.0% | -$32 |
| Mar | 1.0% | $29 |
| Apr | 2.0% | $61 |
| May | 6.1% | $193 |
| Jun | 2.0% | $66 |
| Jul | -0.5% | -$18 |
| Aug | 1.5% | $50 |
| Sep | 2.0% | $68 |
| Oct | 4.6% | $159 |
| Nov | 3.0% | $110 |
| Dec | 1.5% | $55 |
| Total | 27.2% | $816 |
| 2028 | Results % | Results $ |
|---|---|---|
| Jan | 3.5% | $135 |
| Feb | 5.6% | $222 |
| Mar | 2.0% | $83 |
| Apr | 5.6% | $239 |
| May | 2.0% | $89 |
| Jun | 2.0% | $91 |
| Jul | -1.5% | -$71 |
| Aug | -0.0% | -$2 |
| Sep | 0.5% | $22 |
| Oct | 1.5% | $68 |
| Nov | 4.0% | $190 |
| Dec | -1.5% | -$74 |
| Total | 26.0% | $990 |
| 2029 | Results % | Results $ |
|---|---|---|
| Jan | 3.0% | $145 |
| Feb | -1.5% | -$75 |
| Mar | 1.0% | $47 |
| Apr | -0.0% | -$2 |
| May | 4.0% | $199 |
| Jun | 6.1% | $315 |
| Jul | 3.5% | $192 |
| Aug | 1.0% | $55 |
| Sep | 3.0% | $171 |
| Oct | 5.1% | $298 |
| Nov | 0.5% | $29 |
| Dec | -4.0% | -$244 |
| Total | 23.5% | $1,127 |
| 2030 | Results % | Results $ |
|---|---|---|
| Jan | -1.0% | -$61 |
| Feb | 4.6% | $268 |
| Mar | 5.1% | $312 |
| Apr | 6.7% | $431 |
| May | 6.1% | $423 |
| Jun | 2.5% | $182 |
| Jul | 2.0% | $148 |
| Aug | 1.0% | $74 |
| Sep | 0.5% | $36 |
| Oct | 4.6% | $354 |
| Nov | 4.0% | $327 |
| Dec | -0.0% | -$3 |
| Total | 42.0% | $2,492 |
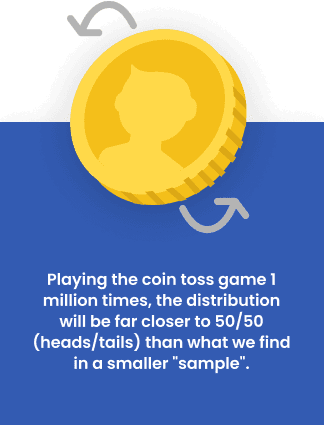
Why this is just a coin flip with extra steps.
Flip a coin ten times and the split can land 10:0 either way. Flip it a million times and you converge on 50:50. That is the Law of Large Numbers: small samples are noisy; large samples settle into the underlying probability.
Trading is the same problem. Ten trades will not tell you whether your system has edge, the noise is louder than the signal. Run the same parameters across hundreds of randomized sequences and the actual shape of the strategy emerges, not just one of its possible faces.
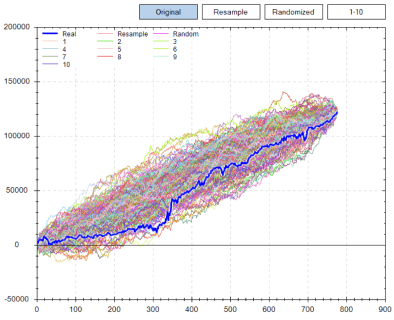
Each pass produces a different equity curve because the order of wins and losses changes. The output is a probability distribution of outcomes, with the worst case sitting next to the median sitting next to the best case. The number that matters most is rarely the median. It is the worst run. If your worst run survives, the strategy survives.
What this tells you that a single backtest can't.
A backtest is one history. Change the order of trades and the curve moves; reality is closer to a population of possible curves than to the one you happen to look at. A Monte Carlo run draws that population.
Maximum drawdown, risk of ruin, expected annual return, and return-to-drawdown ratios surface as distributions instead of single numbers. You stop seeing the strategy as one outcome and start seeing it as the realistic spread, with the worst plausible drawdown sitting right next to the median.
Plan for the worst run, not the average one. The point of the simulation is the lesson the worst run teaches before you have to learn it live.
Stop simulating, start tracking.
The simulator is the floor. The Notion databank Pro members use to journal every real trade is what turns the math into a system you can trust.
See the Pro tier→